Key Features:
- Stock-level factor labels: Construct customized portfolios with your own weights
- Interactive analysis tool: Visualize factor and portfolio returns, backtest strategies for multiple portfolio strategies
- Tradable stock universe: Filters for illiquid stocks
- Flexible universes: Top 300, top 500, and full tradable universe options.
- India-specific breakpoints: Portfolio cut points based on Indian market structure.
Ongoing Research: Besides enhancing factors, focus areas for the finance group include applications to fund management, machine learning pipelines, portfolio optimization, and modeling transaction costs. We will share updates periodically. and those Individuals interested in collaborating with us are welcome to write to factor.boosting@gmail.com.
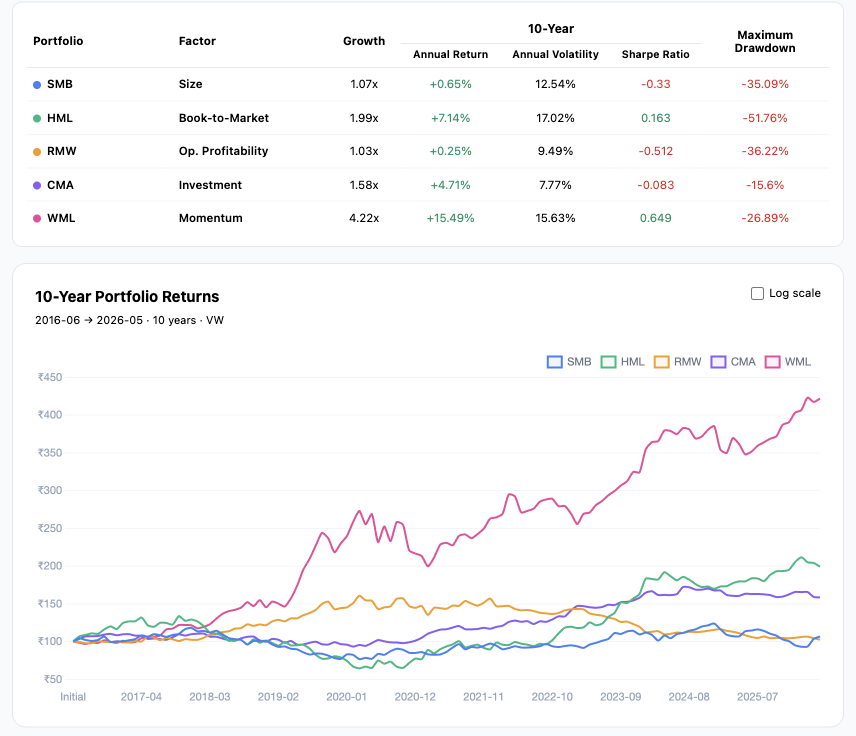
Research Factors & Portfolios
11 Research Factors
|
May 2026 (Returns %) |
Last 3 Months (Returns %) |
Last 12 Months (Returns %) |
||
|---|---|---|---|---|
| Rm-Rf (Using Nifty 500) | -0.12% | -2.20% | -4.07% | Visualize → |
| SMB | +2.71% | +14.90% | -4.90% | Visualize → |
| HML | -2.07% | -5.28% | +11.52% | Visualize → |
| WML | +1.09% | +3.77% | +21.29% | Visualize → |
| RMW | -2.51% | -3.87% | -5.31% | Visualize → |
| CMA | -0.55% | -4.86% | -5.51% | Visualize → |
|
Other Factors
|
||||
| AT (Asset Turnover) | -1.21% | -5.37% | -5.99% | Visualize → |
| SG (Sales Growth) | -0.48% | -0.30% | +3.29% | Visualize → |
| ACC (Accruals) | -2.91% | -7.70% | -6.50% | Visualize → |
| VOL (Volatility) | -8.73% | -16.69% | -9.88% | Visualize → |
| STR (Short-Term Reversal) | -6.54% | -0.03% | -5.03% | Visualize → |
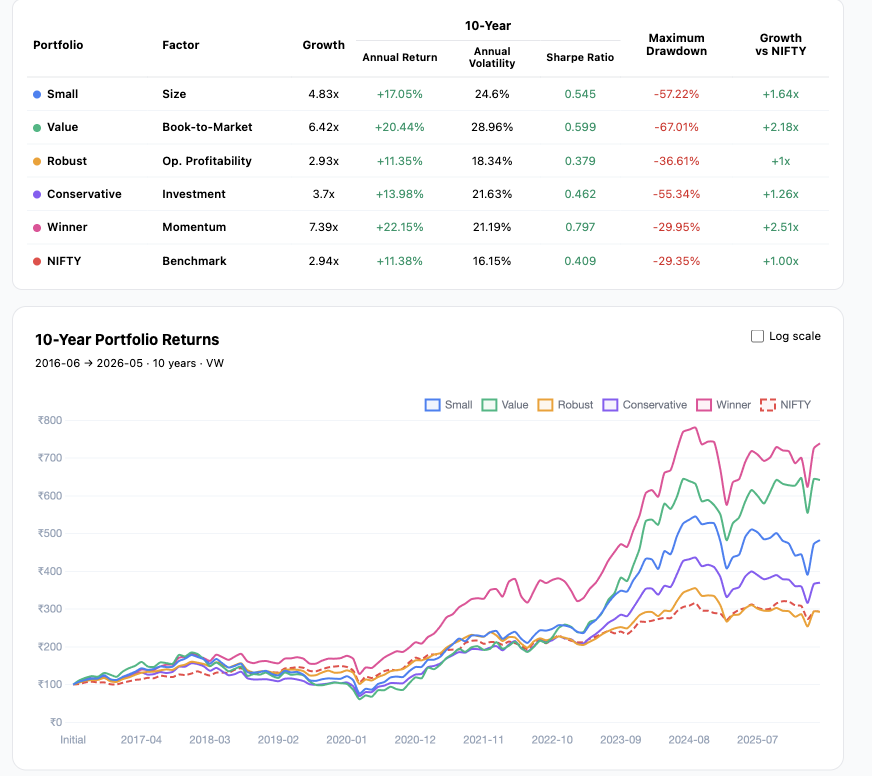
Double Sort Portfolio Returns
Core Factors
Other Factors
Size and Book-to-Market Portfolios
| May 2026 (Returns %) |
Last 3 Months (Returns %) |
Last 12 Months (Returns %) |
||
|---|---|---|---|---|
| Small Value | +1.56% | +8.74% | +3.73% | Visualize → |
| Small Neutral | +1.55% | +8.08% | -1.67% | Visualize → |
| Small Growth | +2.30% | +8.85% | -2.72% | Visualize → |
| Big Value | -2.24% | -9.09% | +15.91% | Visualize → |
| Big Neutral | -1.63% | -6.68% | +0.53% | Visualize → |
| Big Growth | +1.16% | +2.23% | +0.52% | Visualize → |
Size and Operating Profitability Portfolios
| May 2026 (Returns %) |
Last 3 Months (Returns %) |
Last 12 Months (Returns %) |
||
|---|---|---|---|---|
| Small Robust | +0.17% | +8.24% | +1.11% | Visualize → |
| Small Neutral | +3.14% | +12.70% | +7.20% | Visualize → |
| Small Weak | +3.77% | +11.68% | +1.39% | Visualize → |
| Big Robust | +0.69% | -0.49% | +0.29% | Visualize → |
| Big Neutral | -0.06% | -2.81% | +1.53% | Visualize → |
| Big Weak | +2.10% | +3.56% | +10.25% | Visualize → |
Size and Investment Portfolios
| May 2026 (Returns %) |
Last 3 Months (Returns %) |
Last 12 Months (Returns %) |
||
|---|---|---|---|---|
| Small Conservative | +3.04% | +8.91% | -3.33% | Visualize → |
| Small Neutral | +1.15% | +7.68% | -1.42% | Visualize → |
| Small Aggressive | +1.96% | +10.26% | -2.04% | Visualize → |
| Big Conservative | +0.24% | -0.79% | -2.07% | Visualize → |
| Big Neutral | -0.70% | -4.11% | +0.29% | Visualize → |
| Big Aggressive | +2.43% | +6.77% | +6.37% | Visualize → |
Size and Momentum Portfolios
| May 2026 (Returns %) |
Last 3 Months (Returns %) |
Last 12 Months (Returns %) |
||
|---|---|---|---|---|
| Small Loser | -1.63% | +3.59% | -15.75% | Visualize → |
| Small Neutral | +1.57% | +7.29% | -4.01% | Visualize → |
| Small Winner | +3.59% | +11.86% | +7.57% | Visualize → |
| Big Loser | +3.22% | -2.47% | -10.62% | Visualize → |
| Big Neutral | -0.35% | -2.48% | -5.62% | Visualize → |
| Big Winner | +0.18% | -0.82% | +6.23% | Visualize → |
Size and Asset Turnover Portfolios
| May 2026 (Returns %) |
Last 3 Months (Returns %) |
Last 12 Months (Returns %) |
|
|---|---|---|---|
| Small High | -0.71% | +5.67% | +0.64% |
| Small Neutral | +3.70% | +12.07% | +2.80% |
| Small Low | +2.67% | +12.62% | +4.08% |
| Big High | +0.81% | -4.57% | -1.23% |
| Big Neutral | +1.29% | +1.71% | +1.56% |
| Big Low | -0.16% | +0.00% | +7.77% |
Size and Sales Growth Portfolios
| May 2026 (Returns %) |
Last 3 Months (Returns %) |
Last 12 Months (Returns %) |
|
|---|---|---|---|
| Small High | +2.58% | +12.11% | +2.86% |
| Small Neutral | +1.54% | +10.09% | +4.44% |
| Small Low | +3.65% | +10.22% | -1.16% |
| Big High | +1.13% | +2.14% | +11.41% |
| Big Neutral | +0.05% | -3.69% | -1.03% |
| Big Low | +1.01% | +4.97% | +8.81% |
Size and Accruals Portfolios
| May 2026 (Returns %) |
Last 3 Months (Returns %) |
Last 12 Months (Returns %) |
|
|---|---|---|---|
| Small Conservative | +2.21% | +7.46% | -3.65% |
| Small Neutral | +2.17% | +9.83% | +0.08% |
| Small Aggressive | +1.01% | +7.97% | -4.12% |
| Big Conservative | -2.45% | -6.31% | -4.03% |
| Big Neutral | +0.34% | -1.43% | +1.60% |
| Big Aggressive | +4.58% | +8.57% | +9.11% |
Size and Volatility Portfolios
| May 2026 (Returns %) |
Last 3 Months (Returns %) |
Last 12 Months (Returns %) |
|
|---|---|---|---|
| Small Low | +1.25% | +5.72% | -2.78% |
| Small Neutral | +0.91% | +7.00% | -3.35% |
| Small High | +5.08% | +16.08% | +4.48% |
| Big Low | -1.52% | -4.57% | -0.33% |
| Big Neutral | +5.56% | +8.52% | +6.96% |
| Big High | +9.18% | +17.00% | +9.31% |
Size and Short-Term Reversal Portfolios
| May 2026 (Returns %) |
Last 3 Months (Returns %) |
Last 12 Months (Returns %) |
|
|---|---|---|---|
| Small Low | +1.18% | +11.70% | -2.85% |
| Small Neutral | +1.46% | +9.48% | +0.77% |
| Small High | +3.02% | +6.68% | -3.69% |
| Big Low | -1.83% | +2.68% | -1.00% |
| Big Neutral | +2.68% | +2.59% | +5.44% |
| Big High | +7.19% | +1.91% | +4.58% |
Downloadable Data Files
Download time-series returns data for research factors and portfolios. All files are in CSV format with monthly frequency.
| Dataset | Description | Period | Frequency | Size | Download |
|---|---|---|---|---|---|
| FF5_Factors_Monthly.csv | Research factor returns (MKT, SMB, HML, WML, RMW, CMA) | 2001 - May 2026 | Monthly | 17 KB | |
| Industry_Returns.csv | Coming soon... | 2001 - May 2026 | Monthly | N/A |
Download returns data for individual portfolios sorted by various characteristics. Files contain detailed portfolio-level data.
| Dataset | Description | Period | Frequency | Size | Download |
|---|---|---|---|---|---|
| Size_BM_Portfolios.csv | 6 Size x Book-to-Market portfolios (2x3) | 2001 - May 2026 | Monthly | 18 KB | |
| Size_OP_Portfolios.csv | 6 Size x Operating Profitability portfolios (2x3) | 2001 - May 2026 | Monthly | 16 KB | |
| Size_INV_Portfolios.csv | 6 Size x Investment portfolios (2x3) | 2001 - May 2026 | Monthly | 16 KB | |
| Momentum_Portfolios.csv | 6 Size x Momentum (2-12 months) portfolios (2x3) | 2001 - May 2026 | Monthly | 12 KB |
Download stock assignment data showing which stocks belong to which portfolios. Useful for replicating portfolio construction.
| Dataset | Description | Period | Frequency | Size | Download |
|---|---|---|---|---|---|
| Stock_Assignments.csv | Stock label assignments to the portfolios | 2001 - May 2026 | Monthly | 60.8 MB |
Data Notes
- All returns are in percentage form
- Missing values appear as blank cells
- For detailed variable definitions, see our documentation
-
This library is free to use for academic purposes. If it contributes to your work, please cite
us.
Foujdar, A., Juneja, S., Kumar, A., & Prabhala, N. 2026. "Risk Factors For the Indian Equity Market: Statistics, Visualization, and an Interactive Tool." Ashoka University Working Paper.
About
Rapid advancements in data, compute, and algorithms are profoundly transforming our world, and we're still in the early stages of this data science, machine learning, and AI revolution.
At SCDLDS, we conduct high-level applied and methodological research in data and learning sciences to aid in informed decision-making and address complex societal challenges. Initially, our work is focused on four key areas: Data-driven financial research, Weather and climate modeling, Reinforcement learning, and Epidemiological modeling.
In addition to our research, we are committed to teaching. We train young minds through engaging coursework and projects, exposing them to a deep and varied mathematical toolkit that helps them uncover hidden patterns in large and complex datasets.
Contact
For reporting bugs, suggestions or feedback, please reach out at: